

사전 구성
part 1에 이어 zabbix 설정을 하고 대시보드 확인까지 하도록 하겠습니다.
zabbix 설치는 아래 part 1을 보고 설치하면 됩니다!
part 1 URL : https://jhdatabase.tistory.com/26
[ Zabbix - DB monitoring 서버 구축 ] part 1
요즘 큰 회사에서도 DB 모니터링을 위해 Zabbix를 많이 쓴다고합니다. 클라우드 콘솔에서 서버단 모니터링과 notification 서비스가 있지만, 어디까지나 서버단 리소스이라 DB를 모니터링할 tool이 필
jhdatabase.tistory.com
서버 리소스 모니터링 설정
■ 첫 Dashboard 화면

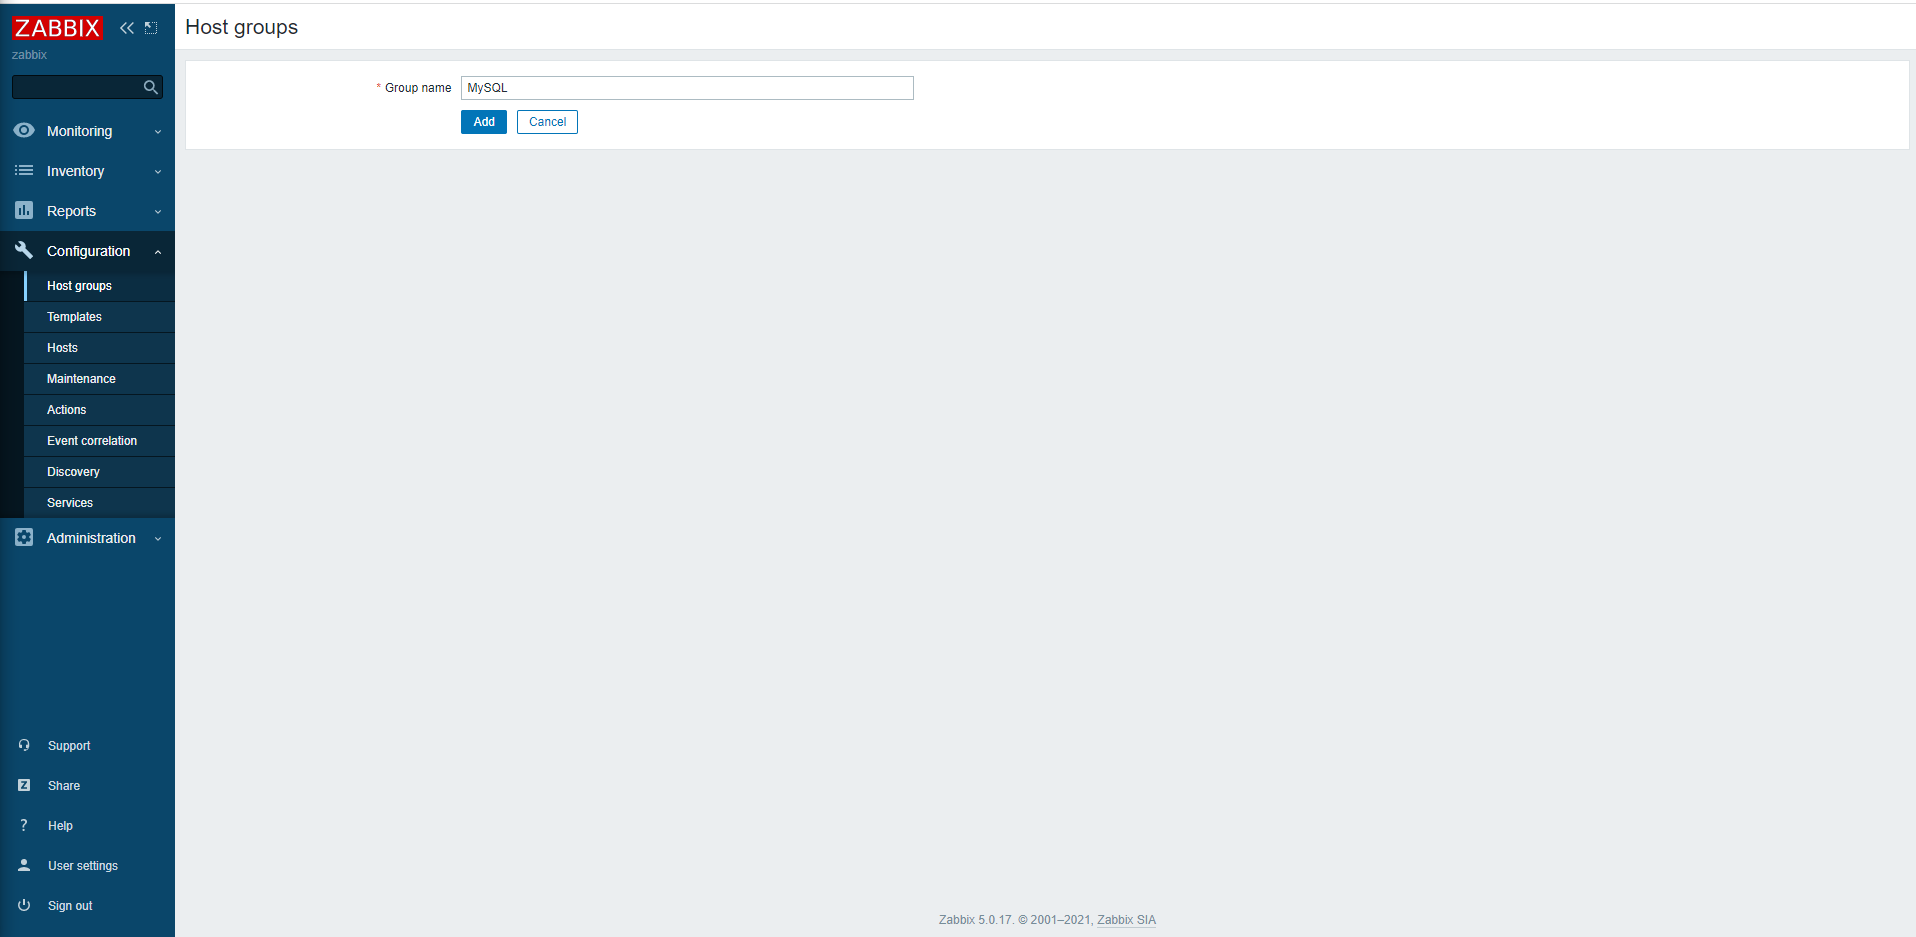
■ Configuration -> Host groups -> Create host group
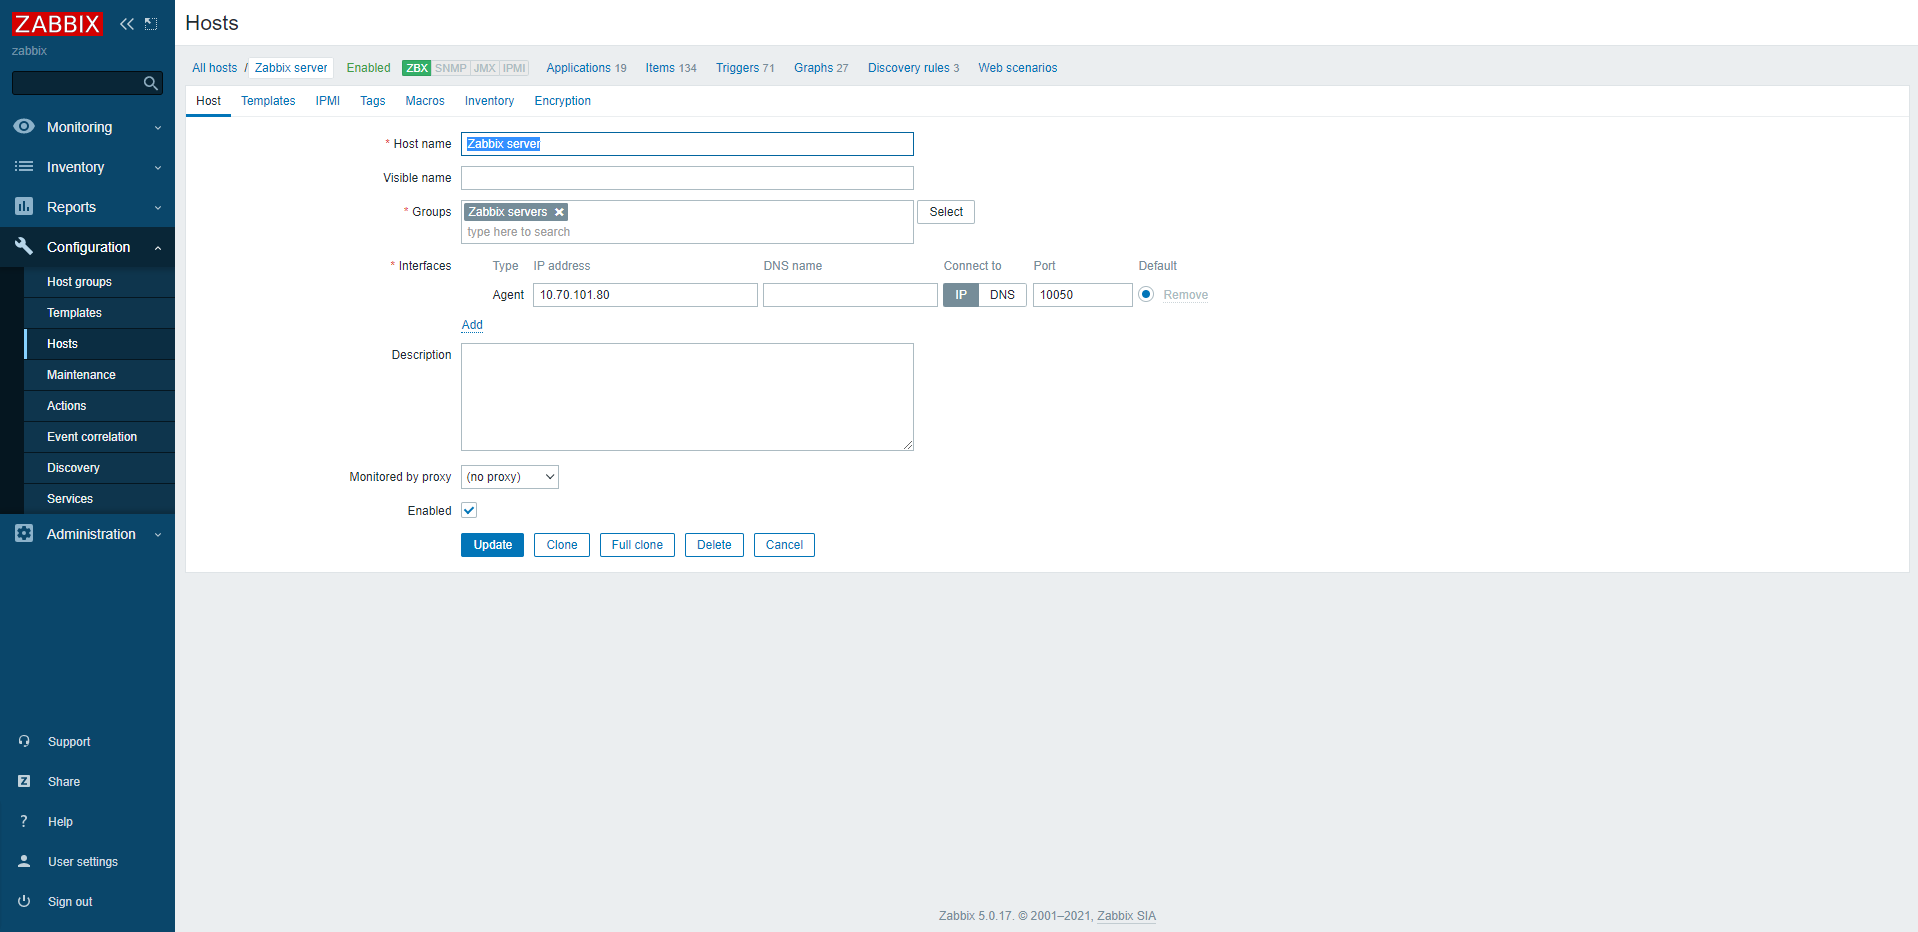
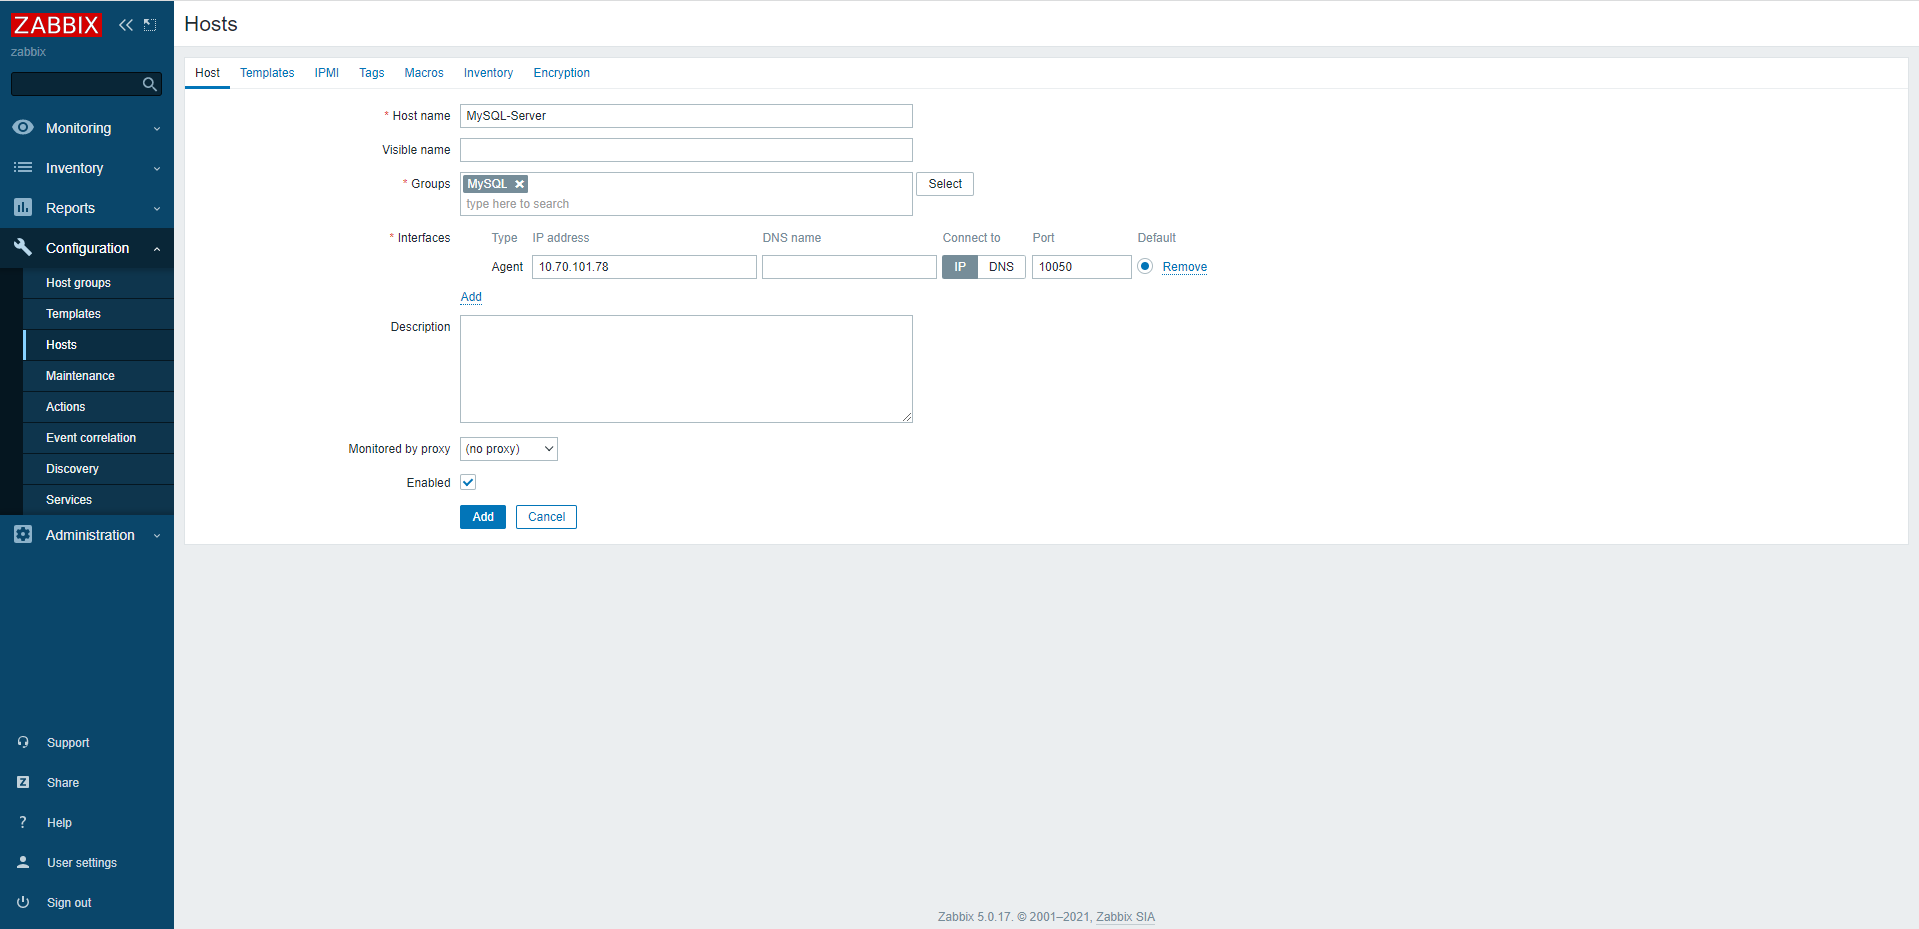
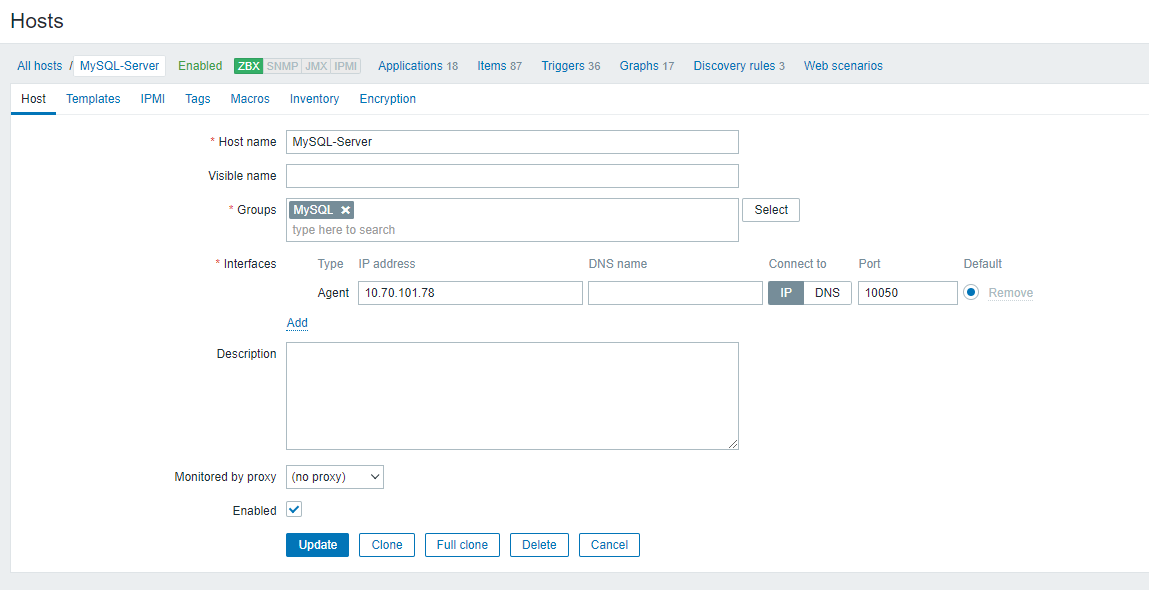
■ Configuration -> Hosts -> Create host
※ Interfaces란에 IP주소는 Agent 서버의 IP를 입력하면 됩니다.
-Zabbix Server
agent.conf에 루프백주소(127.0.0.1)이 아닌 10.70.101.80으로 설정했기때문에 대시보드에서도 수정해줍니다. (127.0.0.1로 했으면 default가 127.0.0.1이기 때문에 그냥 둬도 됩니다.)
-Agent 1
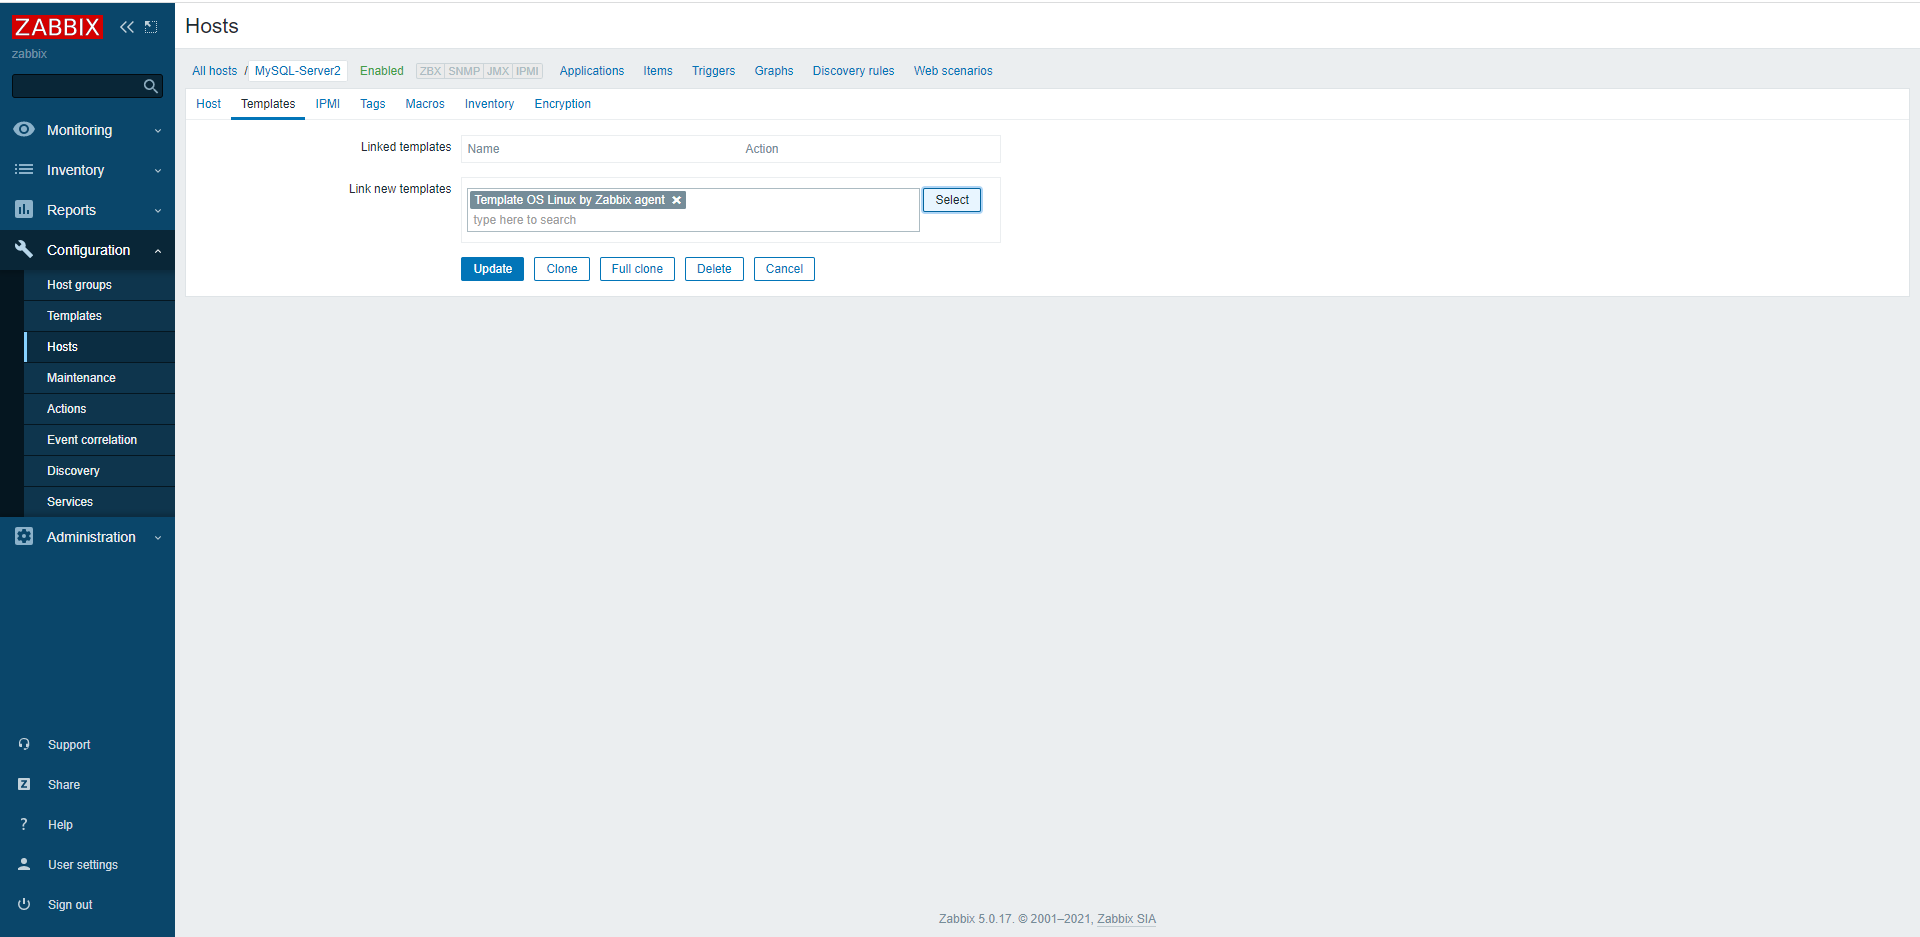
Templates 선택 (사용하는 OS에 맞게 templates 설정)
Templates -> Select -> Operating systems -> Template OS Linux by Zabbix agent

-Agent 2

Templates 선택
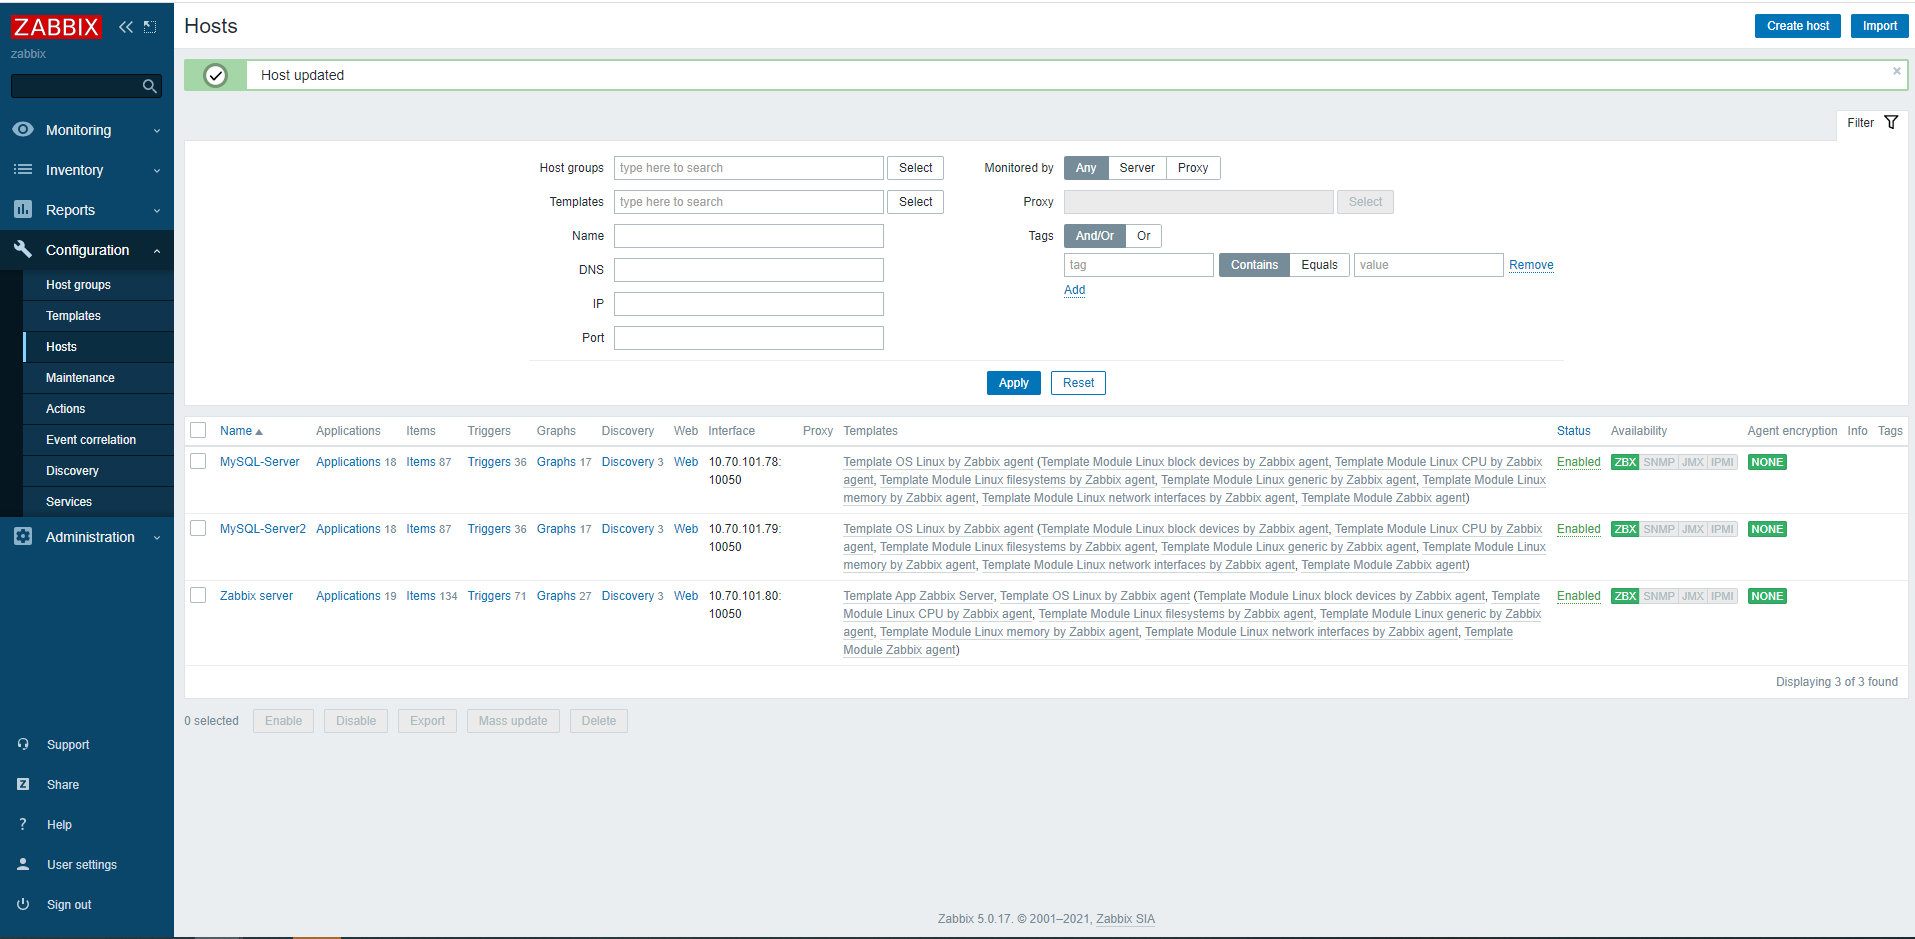
■ Host등록 최종 모습
ZBX프로토콜이 초록색으로 활성화 됐는지 확인.
설정 후 조금 기다려야된다..해당 프로토콜이 서버에서 모니터링한 정보를 가져오는 zabbix 프로토콜인데 안켜지면 당연히 정보 수집을 못해옵니다..
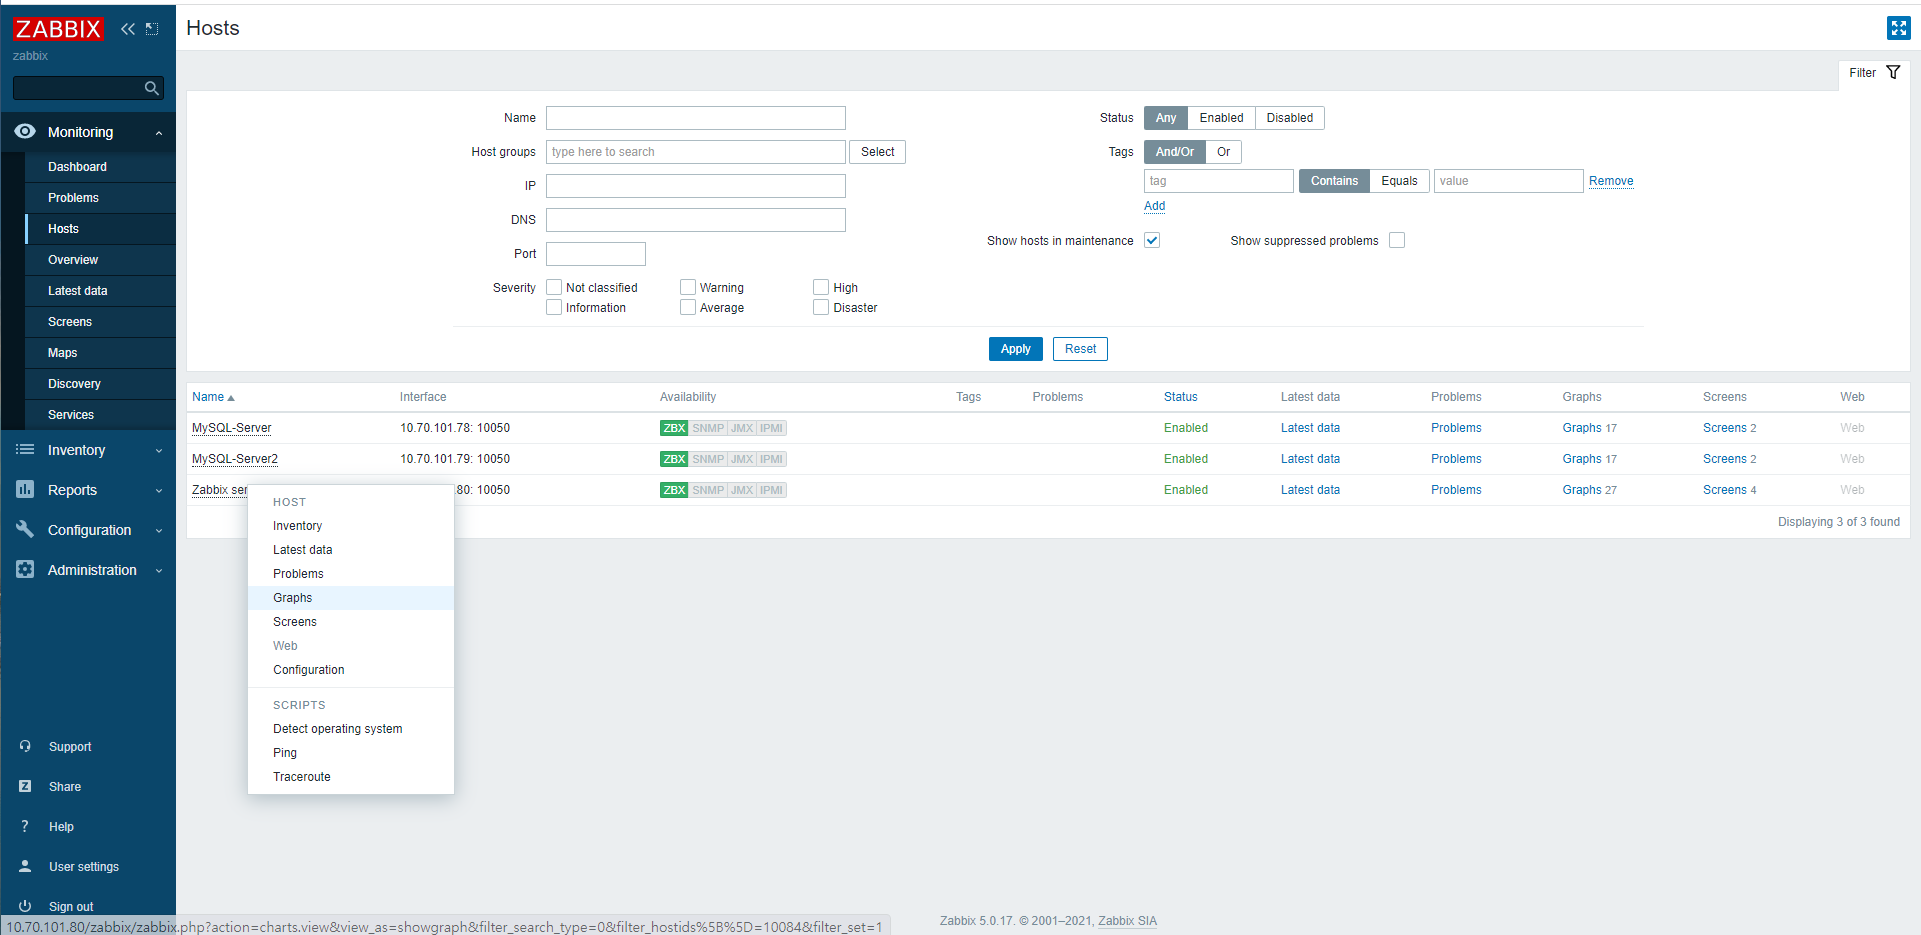
그래프 설정
■ Monitoring -> Hosts -> 호스트 선택 -> Graphs
DB 모니터링 설정
※ DB 모니터링할 서버에 설정
■ monitoring user 생성
MariaDB [(none)]> create user 'monitor'@'%' identified by 'monitor';
Query OK, 0 rows affected (0.04 sec)
MariaDB [(none)]> create user 'monitor'@'localhost' identified by 'monitor';
Query OK, 0 rows affected (0.00 sec)
MariaDB [(none)]> grant all on *.* to 'monitor'@'%';
Query OK, 0 rows affected (0.01 sec)
MariaDB [(none)]> grant all on *.* to 'monitor'@'localhost';
Query OK, 0 rows affected (0.00 sec)
MariaDB [(none)]> flush privileges;
Query OK, 0 rows affected (0.00 sec)
[root@localhost ~]# vi /etc/my.cnf
[client]
user=monitor
password=monitor
[root@localhost ~]# vi /etc/zabbix/zabbix_agentd.conf
Include=/etc/zabbix/zabbix_agentd.d/*.conf
[root@localhost zabbix_agentd.d]# vi /etc/zabbix/zabbix_agentd.d/template_db_mysql.conf
#template_db_mysql.conf created by Zabbix for "Template DB MySQL" and Zabbix 4.2
#For OS Linux: You need create .my.cnf in zabbix-agent home directory (/var/lib/zabbix by default)
#For OS Windows: You need add PATH to mysql and mysqladmin and create my.cnf in %WINDIR%\my.cnf,C:\my.cnf,BASEDIR\my.cnf https://dev.mysql.com/doc/refman/5.7/en/option-files.html
#The file must have three strings:
#[client]
#user='zbx_monitor'
#password='<password>'
#
UserParameter=mysql.ping[*], mysqladmin -h"$1" -P"$2" ping
UserParameter=mysql.get_status_variables[*], mysql -h"$1" -P"$2" -sNX -e "show global status"
UserParameter=mysql.version[*], mysqladmin -s -h"$1" -P"$2" version
UserParameter=mysql.db.discovery[*], mysql -h"$1" -P"$2" -sN -e "show databases"
UserParameter=mysql.dbsize[*], mysql -h"$1" -P"$2" -sN -e "SELECT COALESCE(SUM(DATA_LENGTH + INDEX_LENGTH),0) FROM INFORMATION_SCHEMA.TABLES WHERE TABLE_SCHEMA='$3'"
UserParameter=mysql.replication.discovery[*], mysql -h"$1" -P"$2" -sNX -e "show slave status"
UserParameter=mysql.slave_status[*], mysql -h"$1" -P"$2" -sNX -e "show slave status"
## DB bin 디렉토리 심볼릭링크 추가
[root@localhost zabbix_agentd.d]# ln -s /data/maria/bin/* /bin/
## zabbix-agent 재시작
[root@localhost zabbix_agentd.d]# systemctl restart zabbix-agent
■ Zabbix Server에서 Agent Server DB Data확인
[root@localhost]# yum -y install zabbix-get
[root@localhost]# zabbix_get -s 10.70.101.78 -k mysql.db.discovery["localhost","3306"]
information_schema
mysql
performance_schema
sakila
kim
test
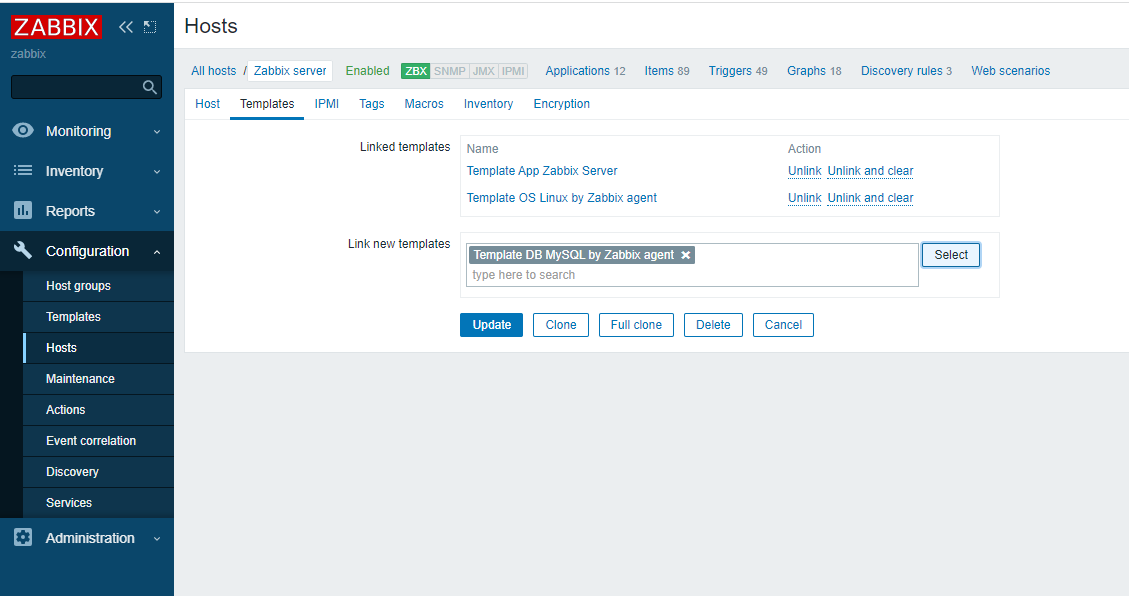
■ GUI 호스트 추가
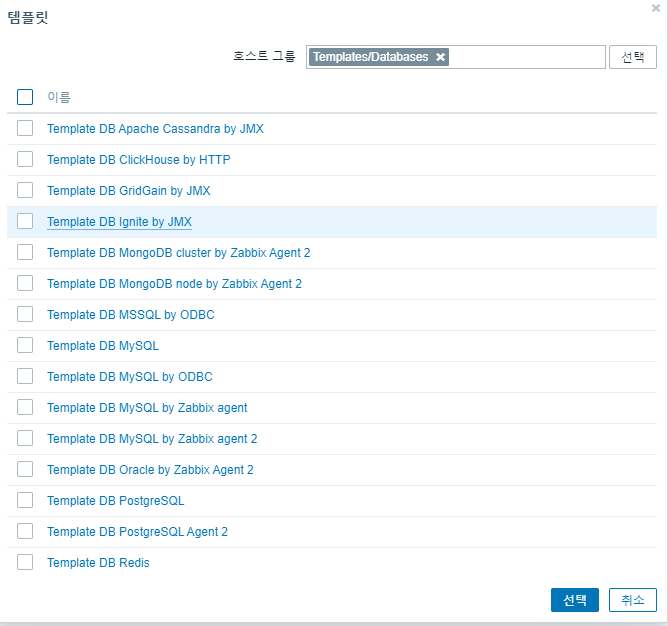
※ Template DB MySQL by Zabbix agent를 골라야 Replication 관련 Discovery가 존재합니다.
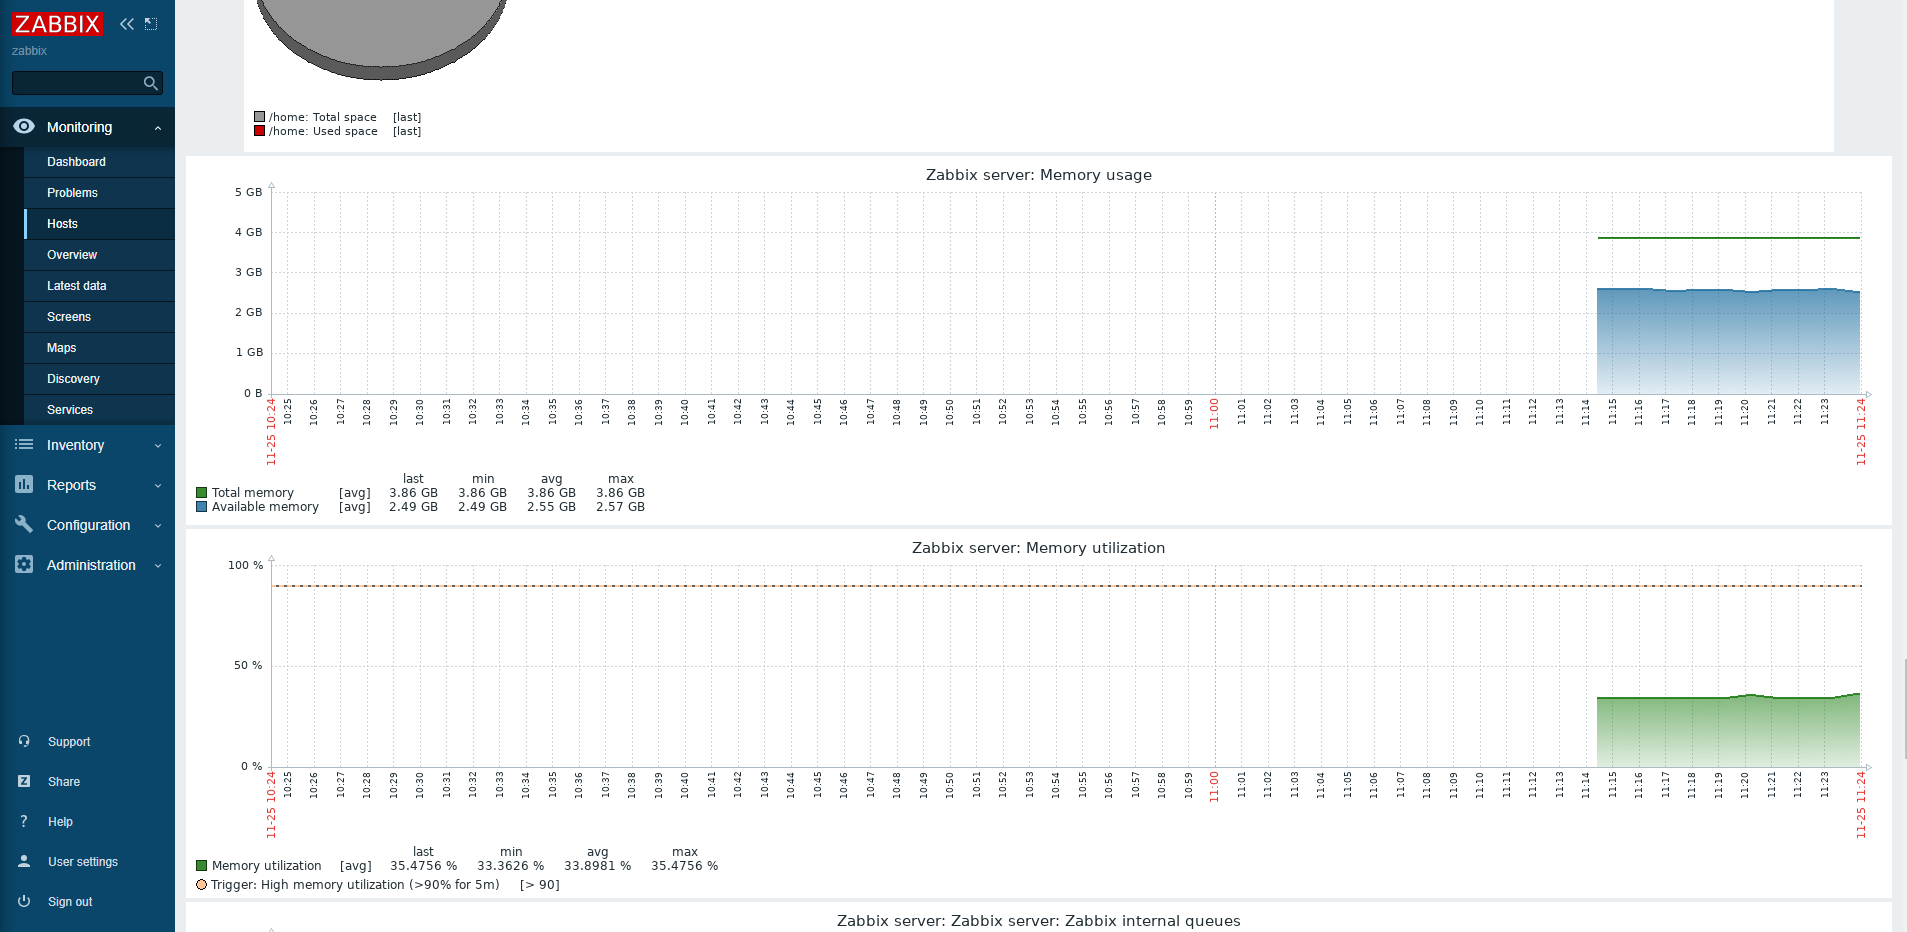
■ 대시보드 확인
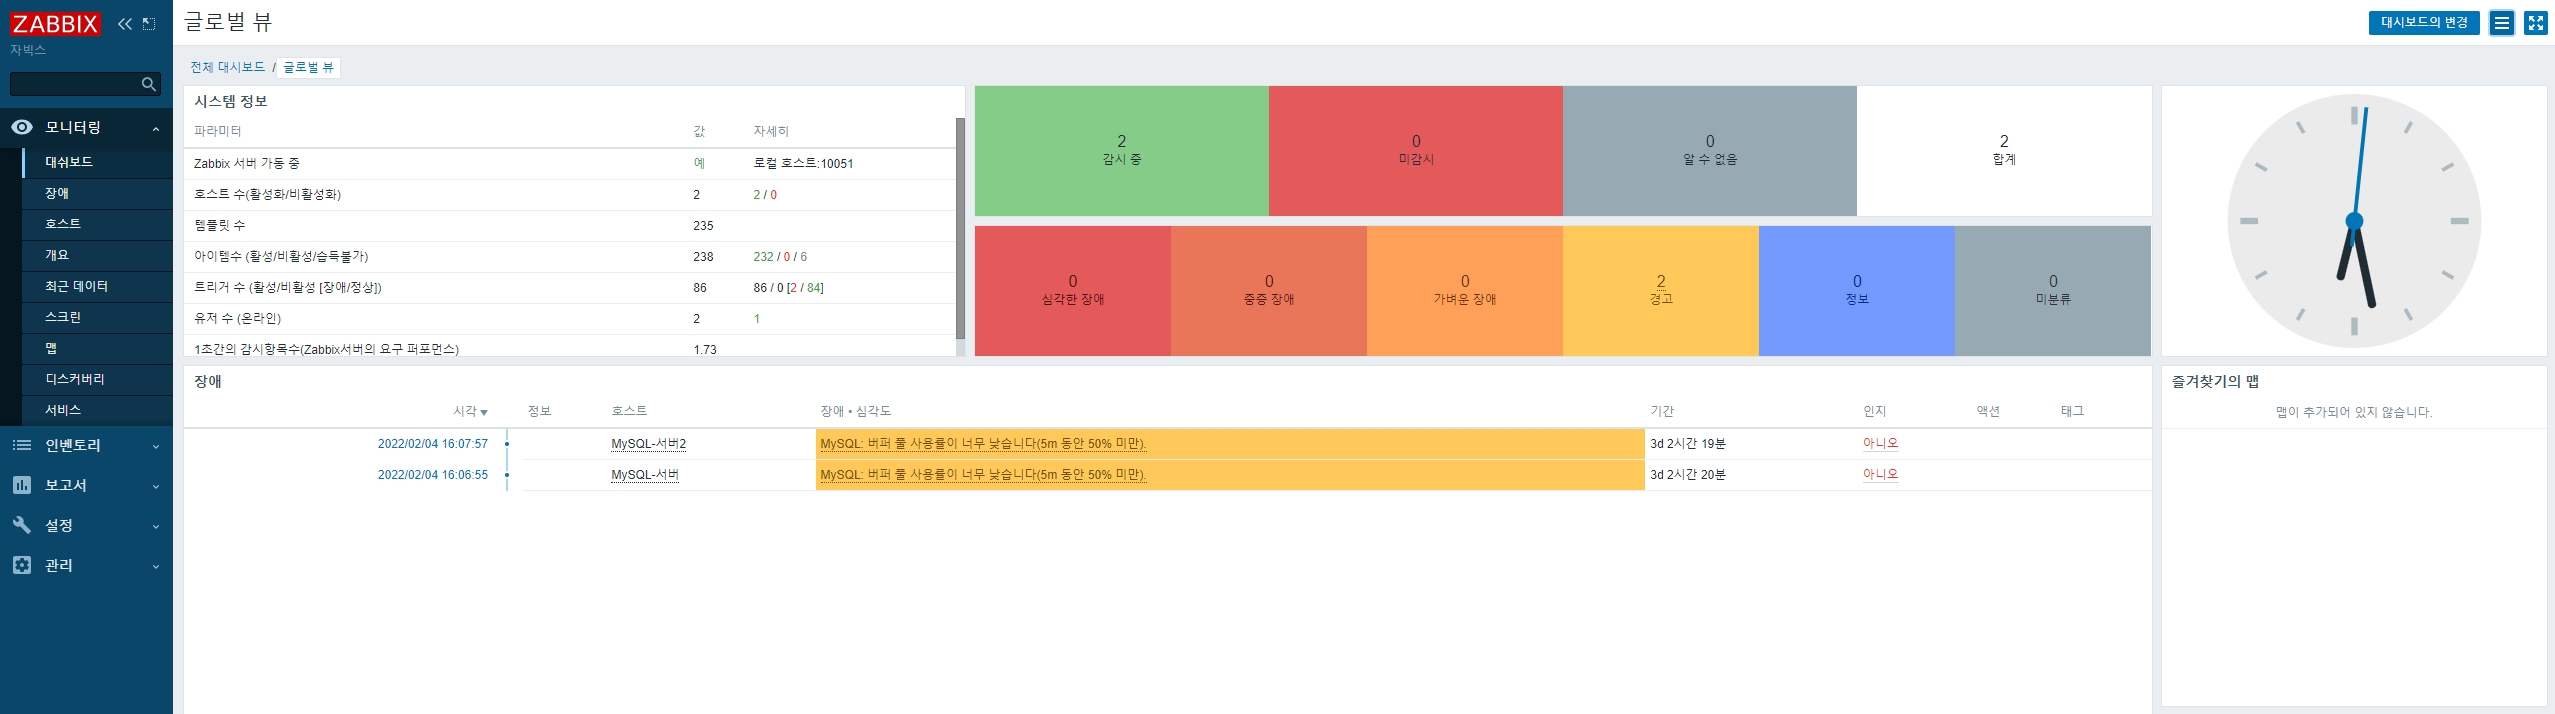
이상으로 자빅스 설정을 마치겠습니다.
다음 글에서는 email 얼롯팅 설정을 하도록 하겠습니다..!
'Others > DB Monitoring' 카테고리의 다른 글
| [ Zabbix - Telegram 연동 & PDF report생성 ] part 4 (0) | 2022.02.07 |
|---|---|
| [ Zabbix - email 얼롯팅 설정 ] part 3 (0) | 2022.02.07 |
| [ Zabbix - DB monitoring 서버 구축 ] part 1 (0) | 2022.02.06 |
| [ Graylog - Email 얼롯팅 설정 ] part 3 (0) | 2022.02.06 |
| [ Graylog - Syslog & DBlog 수집 구성 ] part 2 (0) | 2022.02.05 |